
Grafana Dashboard
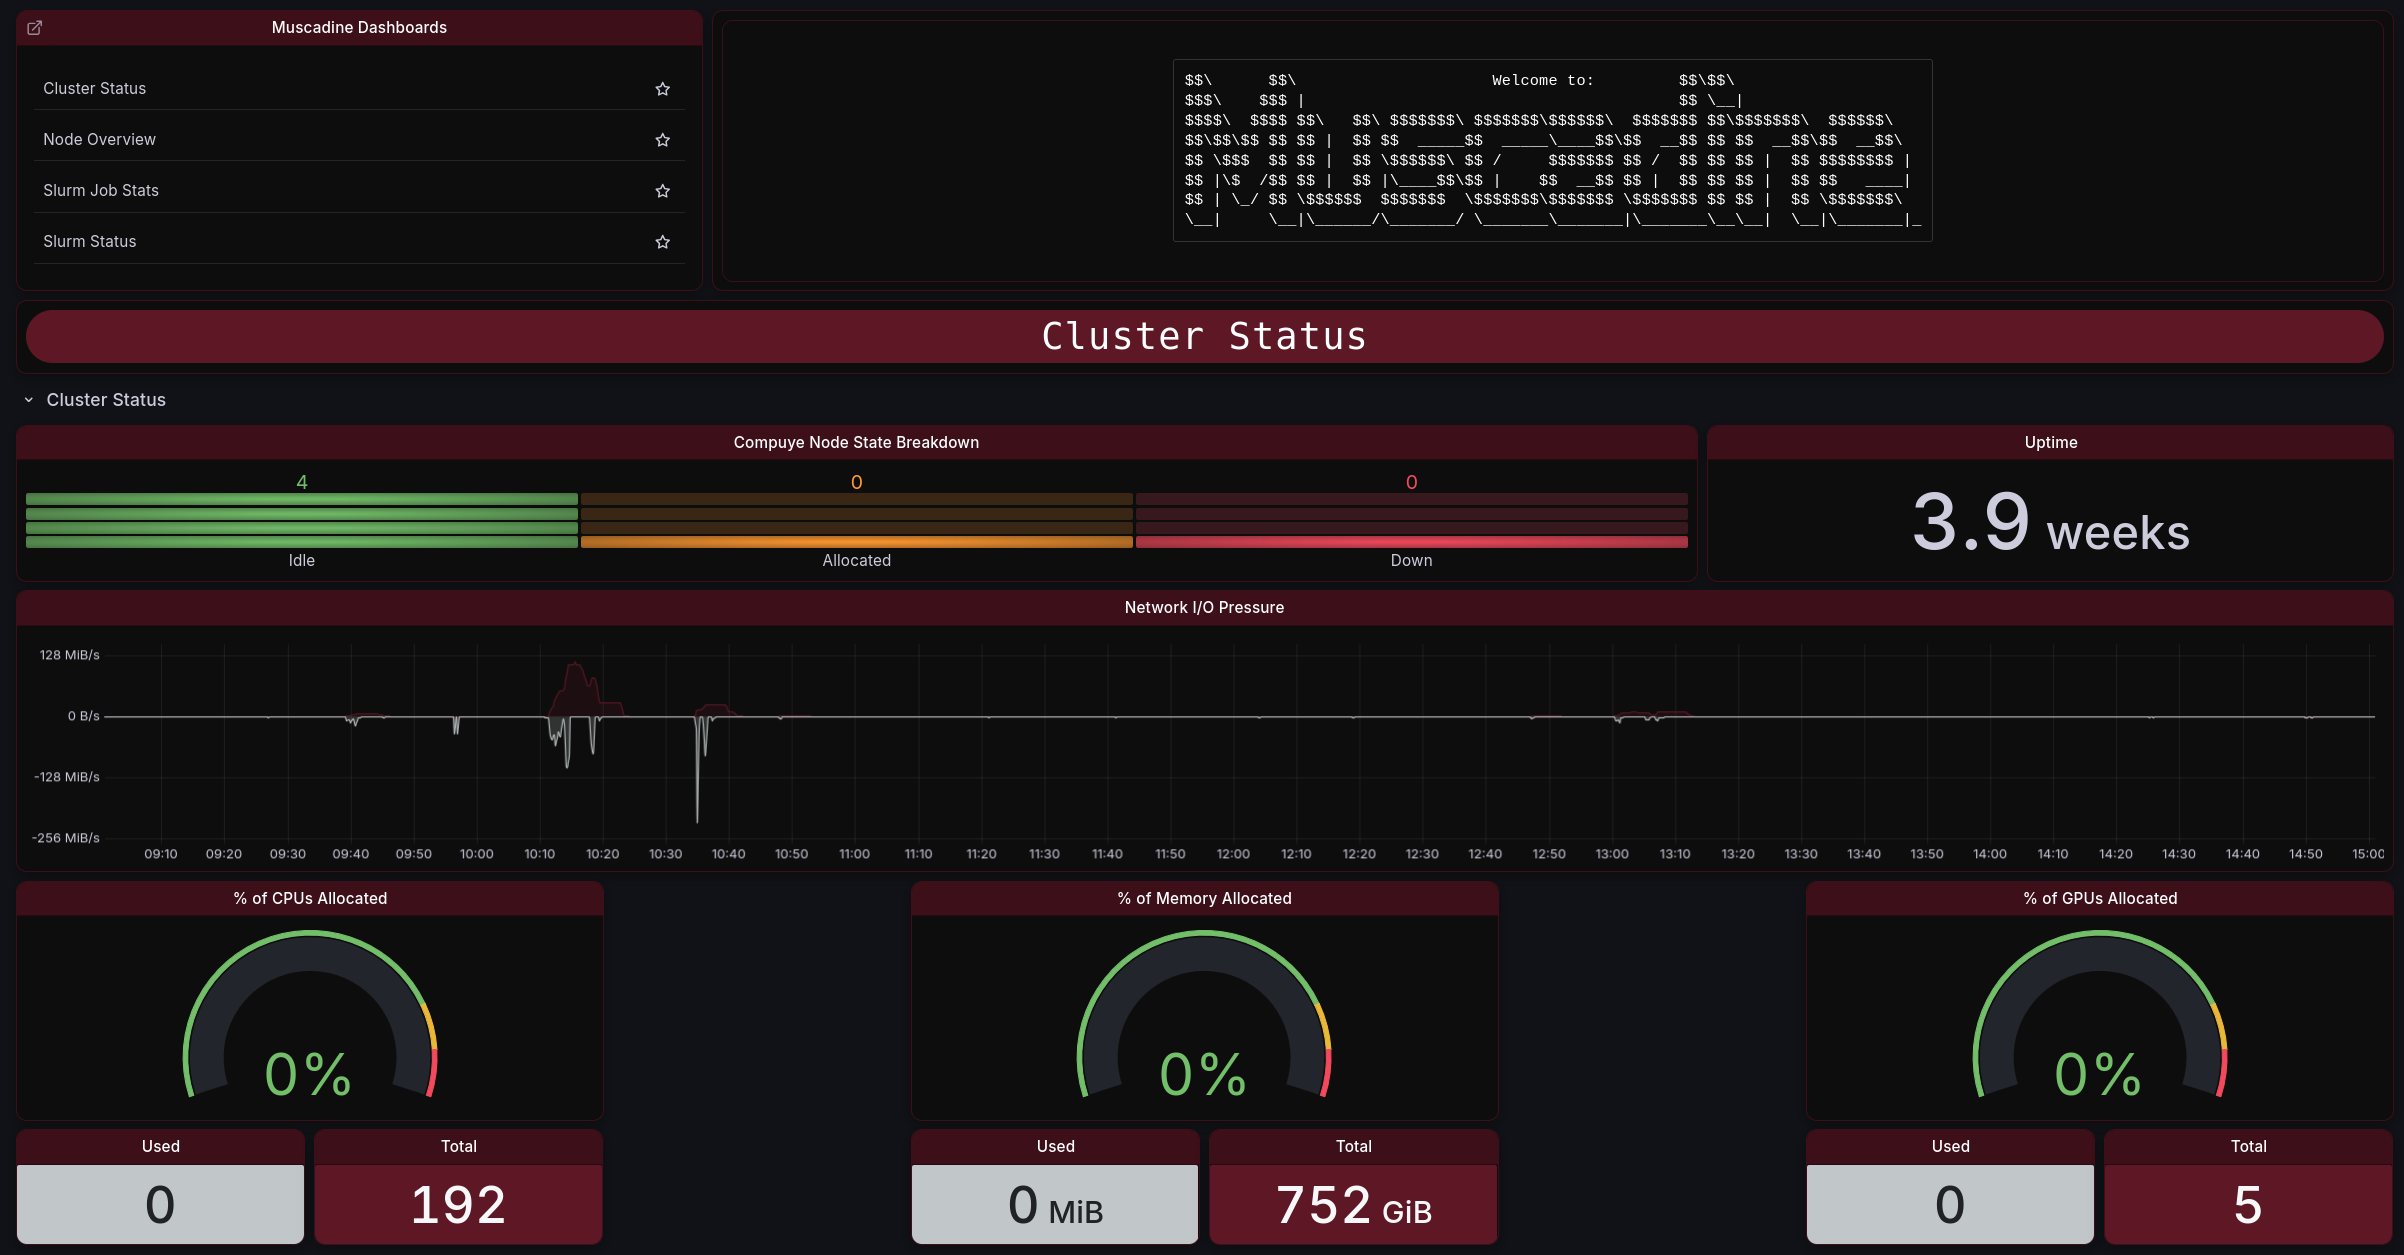
Grafana is an amazing data visualiation dashboarding application that we use to see how the cluster is doing, how much usage there is, and if there are any potential problems. Grafana is avaliable through the Open OnDemand platform located in the Clusters -> System Status page.
Student Contributions
If you are interested in contributing to the Grafana Dashboards, please let our Advisors and/or Student Leadership know!